Fasting Insulin Test: Ranges, HOMA-IR, and What a Good Result Means
A fasting insulin test measures insulin after an 8-12 hour fast. See lab ranges, HOMA-IR, and why resistance can show up before HbA1c.
Written by the Nuvo Longevity editorial team at Firefly Labs LLC.
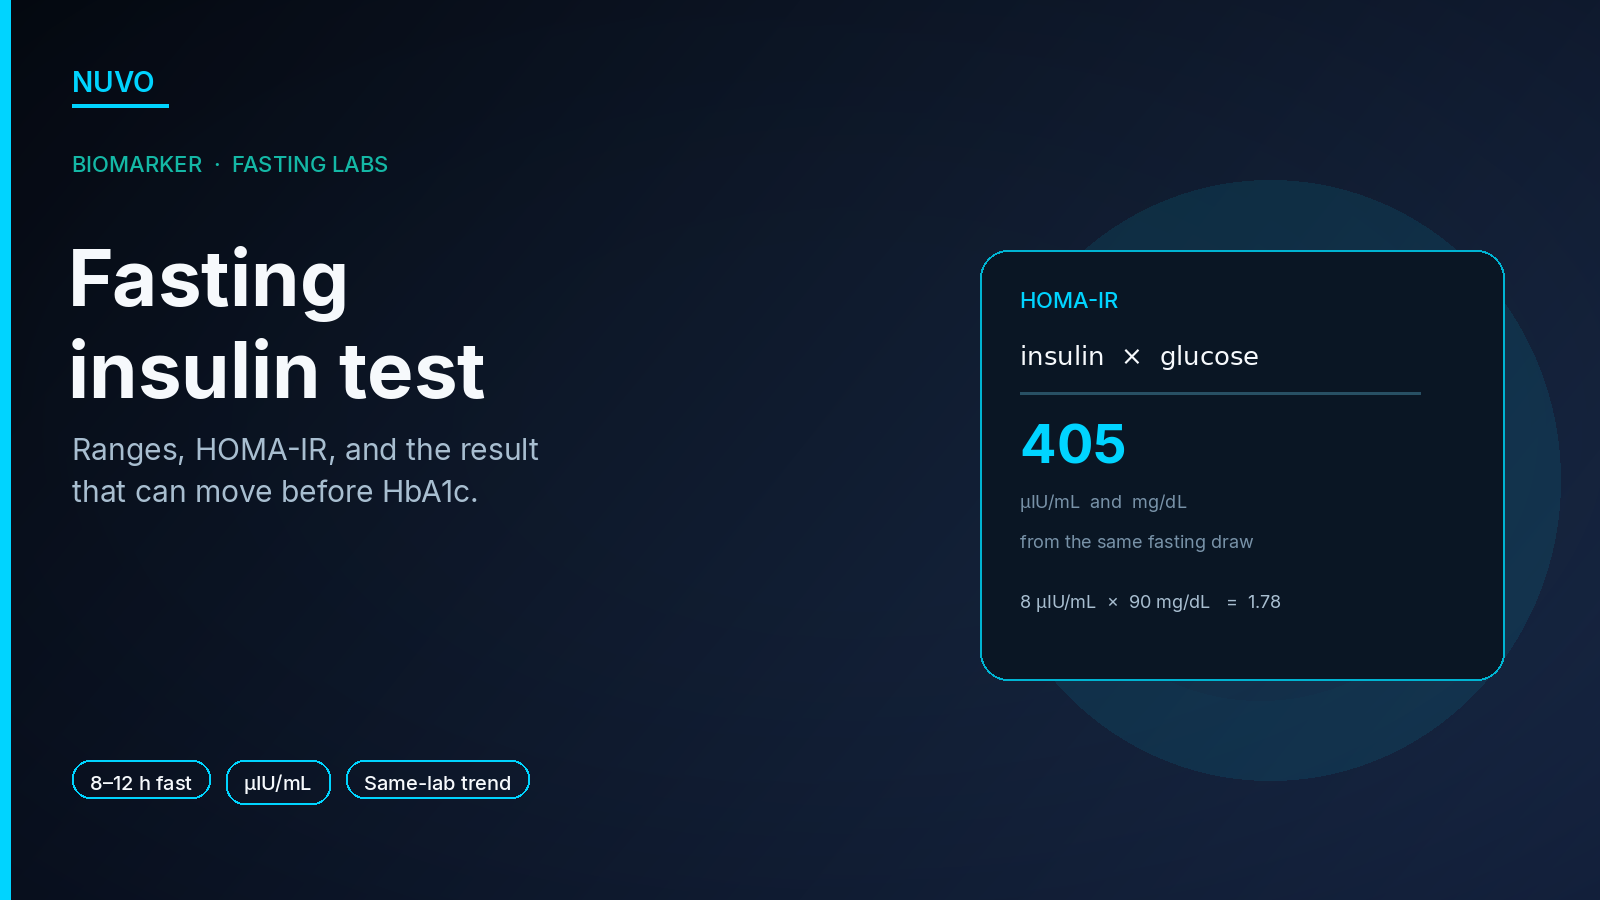
A fasting insulin test measures the insulin in your blood after you have not eaten, usually for 8–12 hours. A result many US labs still print as normal can run from about 2.6 to 24.9 µIU/mL (Labcorp) or up to 18.4 µIU/mL (Quest). Those are reference intervals, not a longevity target: in normoglycemic adults, fasting insulin above 12.2 mU/L specifically flagged clamp-measured insulin resistance, and that signal often appears years before fasting glucose or HbA1c leaves the normal range.
This page is for people who already get periodic blood panels and wear an Apple Watch or Oura. It covers what the test measures, how to read it next to fasting glucose, HbA1c, and HOMA-IR, how to order and prepare for it, what actually moves the number, and how it relates to biological age. It is educational, not medical advice, and it is not a diagnosis of diabetes or prediabetes.
What a fasting insulin test measures
Insulin is the hormone that moves glucose out of the blood and into muscle, fat, and liver cells. After an overnight fast, a healthy pancreas should need only a modest amount of insulin to hold glucose steady. The fasting insulin test is that one number, drawn from serum, reported in micro-international units per milliliter (µIU/mL). That unit is the same as milli-international units per liter (mIU/L or mU/L). Some reports use picomoles per liter (pmol/L) instead.
MedlinePlus describes the blood insulin test as a measure of how much insulin the pancreas is making. Clinicians also use it when they are working up hypoglycemia, including the rare insulin-producing tumor called an insulinoma. That is a different question from the one most longevity panels are asking. If the order is for low blood sugar, the interpretation is whether insulin is inappropriately high while glucose is low. If the order is for metabolic health, the interpretation is whether insulin is already high while glucose still looks ordinary.
A basic metabolic panel does not include it. You have to ask for a fasting insulin, or a serum insulin drawn in the fasting state. Quest's Cardio IQ Insulin (test 91731) requires a fasting specimen. Labcorp's insulin assay (test 004333) publishes a reference interval of 2.6–24.9 µIU/mL and notes that American Diabetes Association recommendations for diagnosing diabetes do not include an insulin level.
Lab "normal" and a tighter result are different numbers
There is no single cutoff that every lab, the ADA, and longevity researchers agree to call optimal. What you can do is put three published windows next to each other and see which question each one answers.
Reference intervals on the report. Quest's Cardio IQ Insulin reference range is ≤18.4 uIU/mL. Quest labels that band "optimal" and values above 18.4 "high," based on its own 2022 reference-interval study, and it says to use the range printed on your report. Labcorp's interval for test 004333 is 2.6–24.9 µIU/mL. A value of 16 µIU/mL can be inside both of those intervals. "Inside the reference interval" means you resemble a slice of the people that lab used to set the range. It does not mean your insulin sensitivity is excellent.
A clamp-based flag in people whose glucose is still normal. McAuley and colleagues compared fasting insulin with a euglycemic clamp, the research measurement of insulin sensitivity, in 178 normoglycemic adults aged 25–68. Fasting insulin above 12.2 mU/L was specific for insulin resistance (specificity 0.82) and only moderately sensitive (sensitivity 0.57). A result above 12.2, with normal glucose, is a strong hint. A result below 12.2 does not clear you. The same paper found fasting insulin alone predicted clamp insulin sensitivity about as well as HOMA in that normoglycemic group.
A tighter population reference interval. A large Brazilian laboratory database proposed a 95% reference interval of 2.52–13.14 µU/mL for fasting insulin and 0.39–2.86 for HOMA-IR, and the authors did not find a reason to split that interval by sex (Arch Endocrinol Metab, 2024). That upper bound sits well below Labcorp's 24.9. It is still a population interval for that database, not a treatment target, and it will not match every US assay.
Assay choice matters as much as the cutoff. Manley and colleagues compared 11 human insulin assays and showed that the same samples do not produce interchangeable numbers. Trend fasting insulin at the same lab, on the same assay. A drop from 14 to 9 across two different laboratories is not automatically an improvement.
If your report is in pmol/L, convert with the factor your lab prints before you use the formulas below. A factor near 6 pmol/L per µIU/mL is common, and labs do not all use the same one.
HOMA-IR is fasting insulin times fasting glucose, divided by 405
HOMA-IR (homeostasis model assessment of insulin resistance) combines the two fasting numbers into one index. Matthews and colleagues published the model in 1985. In US units:
HOMA-IR = fasting insulin (µIU/mL) × fasting glucose (mg/dL) / 405
If glucose is in mmol/L, use the original form instead: fasting insulin (µIU/mL) × fasting glucose (mmol/L) / 22.5. The 405 divisor is 22.5 × 18, and 18 is the conversion from mmol/L to mg/dL. Both versions describe the same relationship. Use the pair from the same blood draw, both fasting.
Two examples, using the mg/dL formula:
- Insulin 8 µIU/mL and glucose 90 mg/dL: 8 × 90 / 405 = 1.78.
- Insulin 18 µIU/mL and glucose 95 mg/dL: 18 × 95 / 405 = 4.22.
The second glucose is still under the ADA prediabetes line of 100 mg/dL, and the second insulin is inside Quest's ≤18.4 interval and inside Labcorp's 2.6–24.9 interval. The HOMA-IR values are not telling the same story. The pancreas in the second case is using much more insulin to hold a similar fasting glucose.
The ADA does not publish a diagnostic cutoff for HOMA-IR. The Brazilian laboratory series above proposed a 95% interval of about 0.39–2.86 for its population. Research papers sometimes flag values around 2 or 2.5, and those thresholds move with the assay and the population. Treat HOMA-IR as a calculated trend from two real lab numbers, and read it with the reference interval on your own report. It is not a disease label.
Fasting insulin, fasting glucose, HbA1c, and HOMA-IR
These four numbers answer different questions. Glucose and HbA1c describe sugar in the blood. Fasting insulin describes how much hormone was required to get there. HOMA-IR is the product of the two fasting values. The HbA1c and biological age article covers the 90-day glucose average on its own. A continuous glucose monitor adds the shape of glucose after meals, which none of these fasting tests show.
| Marker | What it shows | A published reference point | When it tends to move |
|---|---|---|---|
| Fasting insulin | Insulin after an overnight fast. Higher values mean the pancreas is secreting more insulin to hold fasting glucose in place. | Labcorp 2.6–24.9 µIU/mL. Quest Cardio IQ ≤18.4 uIU/mL. In normoglycemic adults, >12.2 mU/L was specific for clamp-defined insulin resistance and missed many cases (sensitivity 0.57). | Can rise while fasting glucose and HbA1c are still in the nondiabetic range, during compensatory hyperinsulinemia. |
| Fasting glucose | Glucose after an overnight fast. A snapshot, not a 90-day average. | ADA: under 100 mg/dL is the nondiabetic fasting range; 100–125 mg/dL is impaired fasting glucose; 126 mg/dL or higher, confirmed, meets a diabetes criterion. | Often stays in range until insulin compensation is no longer enough. In Whitehall II, the steep rise came in the years just before a diabetes diagnosis. |
| HbA1c | Share of hemoglobin glycated by glucose over the life of a red blood cell, roughly 90 days. | ADA: under 5.7% nondiabetic; 5.7–6.4% prediabetes; 6.5% or higher, confirmed, a diabetes criterion. | Follows average glucose. It can sit under 5.7% while fasting insulin is already elevated, because it does not measure insulin. |
| HOMA-IR | Calculated index: fasting insulin (µIU/mL) × fasting glucose (mg/dL) / 405. Not a separate tube of blood. | No ADA diagnostic cutoff. One large lab database proposed a 95% interval of about 0.39–2.86. Assay-dependent. | Moves as soon as either fasting input moves. A high insulin with a still-normal glucose is enough to push it up. |
The ADA criteria in that table are from the 2025 Standards of Care in Diabetes, section on diagnosis and classification. Prediabetes is defined there by HbA1c, fasting plasma glucose, or the 2-hour value on a 75-gram oral glucose tolerance test. Insulin is not on that list. The National Institute of Diabetes and Digestive and Kidney Diseases describes insulin resistance as a state in which muscle, fat, and liver cells respond poorly to insulin, so the pancreas makes more of it. Prediabetes is the later glucose abnormality. They overlap. They are not the same lab result.
Insulin resistance can show up before HbA1c rises
Early on, the pancreas covers for insulin resistance by secreting more insulin. Glucose stays in the laboratory normal range because that extra insulin is still doing the job. HbA1c, which records average glucose, can look fine for the same reason. The fasting insulin is the number that moved.
The cleanest long view of that sequence is the Whitehall II analysis by Tabák and colleagues (Lancet, 2009; open version on PMC). In British civil servants followed until a new diagnosis of type 2 diabetes, HOMA insulin sensitivity was already lower than in people who never developed diabetes as far as 13 years before diagnosis. Fasting and 2-hour glucose rose in a steeper curve only in the last several years before diagnosis. Insulin secretion rose and then fell as the diagnosis approached. The study tracked glucose trajectories, not HbA1c specifically. The practical reading for a panel you repeat every year is the same: glucose-based markers, including HbA1c, are late relative to the insulin-sensitivity change.
McAuley's clamp study makes the same point in people who are still normoglycemic. The group was selected so that glucose was not the clue. Fasting insulin was.
This is also why a single "everything is normal" annual panel can be true on glucose and HbA1c and still miss compensatory hyperinsulinemia. If you are building a longevity panel, fasting insulin belongs on the requisition next to fasting glucose and HbA1c, not instead of them. A broader list of aging-related labs is in which blood panels say the most about rate of aging.
How to get tested
Two routes cover almost everyone who wants this number.
A clinician's order. Ask for a fasting insulin (serum insulin, fasting) on the same draw as fasting glucose, HbA1c, and a lipid panel. The glucose has to be from that same morning if you want a valid HOMA-IR. Primary care, endocrinology, and direct primary-care practices that already order quarterly panels can add the test. It is a standard immunoassay at Quest and Labcorp, not a specialty send-out in most US markets.
Direct-to-consumer labs. QuestHealth and Labcorp OnDemand sell insulin tests that are still venous draws at those companies' service centers. You skip the clinic visit and you still get a clinical assay with that lab's reference interval. Order the fasting version, and book a morning appointment so the fast is real. Other marketplaces resell the same Quest or Labcorp assays. The brand on the storefront matters less than which laboratory runs the test and whether you can repeat it there.
Expect a cash price that is much smaller than a full-body MRI and large enough that you will not want to redraw it every week. Prices move. Read the current listing rather than a blog's stale dollar figure. Insurance coverage is inconsistent because the test is not an ADA diagnostic criterion for prediabetes. A clinician's note that you are evaluating insulin resistance is sometimes what gets it paid, and sometimes it does not.
If you inject insulin, read the assay limitations before you interpret the result. Labcorp's test 004333 is highly specific for human insulin and does not detect several insulin analogs. A low number in that setting can mean the assay cannot see the insulin you took. That is a medication question for the ordering clinician, not a metabolic win.
Prep is an 8–12 hour fast, then a morning draw
Quest's Cardio IQ Insulin listing says a fasting specimen is required. Its timed insulin-response protocol says overnight fasting, nothing by mouth after midnight. In practice, plan on 8–12 hours without calories. Water is fine. Black coffee, cream, juice, and a "small" breakfast all break the fast, and a sweetened coffee is enough to raise insulin before the needle.
Book the draw in the morning. Insulin has a daily rhythm, so a noon sample after a late breakfast skip is not comparable to your last 7 a.m. result. Take prescription medicines the way the ordering clinician told you to. If the requisition is silent, ask. Do not stop a medication for a longevity lab on the strength of an article.
Skip a hard workout the morning of the draw. A single bout of exercise changes insulin sensitivity for hours afterward, which is useful in training and noisy on a fasting lab. Sit the easy day, get the blood, then train.
Repeat the test under the same conditions: same lab, similar clock time, similar fast, not the morning after a red-eye or a race. One elevated result is a reason to confirm. A trend across two or three identical draws is the number worth acting on.
What moves fasting insulin
Fasting insulin falls when muscle, liver, and fat tissue need less insulin to handle glucose, or when there is less glucose to handle. The levers with human evidence are ordinary. They also show up on a watch, which is the useful part if you only redraw blood a few times a year.
Zone 2 and other aerobic work
The American Diabetes Association physical-activity position statement (Colberg and colleagues, 2016) recommends regular aerobic exercise and resistance training because both improve insulin sensitivity and glucose control. Bird and Hawley reviewed the human data: one exercise bout can increase insulin sensitivity for many hours, and repeated training is what maintains the effect. Zone 2 is the easy aerobic band you can still talk through, and it is the practical way to accumulate that aerobic volume without turning every week into intervals. How to find the zone on a wearable is covered in zone 2 training. The insulin change comes from the aerobic work, not from a specific heart-rate app badge.
Strength training
Muscle is where most insulin-stimulated glucose disposal happens. The same ADA statement treats resistance training as a partner to aerobic work, not a substitute you add only after the scale moves. Two to three full-body sessions a week is the pattern those guidelines describe for glycemic benefit. You do not need a fasting insulin draw to know whether those sessions happened. Your training log already has that.
Sleep
Spiegel, Leproult, and Van Cauter restricted 11 young men to 4 hours in bed for six nights and compared that with a recovery stretch of 12 hours in bed. Glucose tolerance was lower in the short-sleep condition, evening cortisol was higher, and sympathetic activity was higher. That experiment did not hand you a fasting-insulin delta to quote, and it was a small study of young men. It is still the clearest controlled evidence that a week of short sleep strains carbohydrate metabolism, which is the system fasting insulin is reporting. An Oura or Apple Watch sleep trend is the daily version of that input. One short night will not rewrite a lab. A month of five-hour nights can.
Fiber
Breneman and Tucker found that women with higher soluble-fiber intake had lower HOMA-IR than women with lower intake. Body fat and physical activity explained part of the association, not all of it. Separately, the Reynolds Lancet series on carbohydrate quality reported that people who ate the most dietary fiber had a lower incidence of type 2 diabetes than people who ate the least, and that fiber in trials reduced body weight. Fiber is a food pattern, not a supplement protocol. The papers do not support a claim that a particular gram dose will drop your fasting insulin by a set amount next month.
Weight, especially when there is excess fat to lose
Magkos and colleagues randomized adults with obesity to about 5%, 11%, or 16% weight loss. Five percent weight loss improved insulin sensitivity in adipose tissue, liver, and skeletal muscle, and it improved beta-cell function. Further loss added more muscle insulin sensitivity. If your weight is already stable and lean, this lever is smaller than training and sleep. If it is not, it is often the largest one on the list.
None of these changes is a promise that next quarter's insulin will print a specific number. They are the inputs clinical trials and controlled studies have actually tied to insulin sensitivity. Track the inputs on the watch while you wait for the next draw.
How fasting insulin relates to biological age
Biological age models try to estimate physiological aging from measured biology rather than from a birth date. Fasting insulin is a metabolic input to that story. It is not, by itself, a biological age.
Facchini, Hua, Abbasi, and Reaven followed apparently healthy people and found that insulin resistance predicted who later developed age-related disease, including hypertension, coronary heart disease, stroke, cancer, and type 2 diabetes. The paper used a research measure of insulin resistance (steady-state plasma glucose), not a consumer HOMA-IR printout. The direction is the point: insulin resistance tracked future age-related disease in people who did not yet look sick on a problem list.
The widely cited phenotypic-age model in Levine and colleagues, 2018, uses nine blood chemistries plus chronological age. Glucose is in that model. Fasting insulin is not. C-reactive protein and creatinine are in it. HbA1c is not. A glucose-based aging score can therefore look acceptable while the pancreas is already compensating. That is the gap a fasting insulin fills. It does not replace the glucose markers. It tells you whether those glucose markers are being held down by extra insulin.
Wearable signals sit on a different clock. Resting heart rate, heart-rate variability, VO2 max, sleep, and steps move in days or weeks. Fasting insulin moves on the schedule of your training, sleep, and body composition, and you only see it when you redraw blood. The useful comparison is whether the weeks of zone 2, lifting, and sleep that your watch recorded line up with a lower insulin on the next identical lab. If the habits were real and the insulin did not move, that is information. If the habits were not real, the lab was never going to be the first place you noticed.
What Nuvo does with this, and what it does not
Fasting insulin is not one of Nuvo's 21 biomarkers. Nuvo does not read a fasting insulin value, and it should not be described as if it did.
Nuvo is an iPhone and Apple Watch app. It calculates a daily biological age score from 21 biomarkers: wearable data read through HealthKit, plus optional lab results. The blood markers Nuvo uses are HbA1c, fasting glucose, HDL, CRP, and creatinine. The wearable signals include resting heart rate, heart-rate variability, VO2 max, sleep, and steps. Apple Watch records those directly. Oura data reaches the app when it is in Apple Health. The full list is in what the 21 longevity biomarkers are.
That split is the honest way to use the two tools together. Keep fasting insulin, and the HOMA-IR you calculate from it, on the lab report you and your clinician review a few times a year. Use Nuvo to watch the daily half of the same physiology: fasting glucose and HbA1c when you choose to enter them, and the HealthKit signals that move when zone 2, strength, sleep, and steps change. The score updates daily. The insulin lab does not.
Processing is on-device AI. Nuvo does not require an account. The App Store privacy label is Data Not Collected. The subscription is $4.99/month or $24.99/year, with a 7-day free trial.
Frequently asked questions
What is a fasting insulin test?
A fasting insulin test measures the concentration of insulin in serum after you have not eaten, typically for 8–12 hours. It shows how much insulin the pancreas is secreting to hold fasting glucose steady. It is a separate order from a basic metabolic panel. MedlinePlus describes the blood insulin test, and US labs such as Quest and Labcorp run it as a standard immunoassay.
What is a good fasting insulin result?
There is no single official optimal cutoff. Labcorp's published interval for its insulin assay is 2.6–24.9 µIU/mL, and Quest's Cardio IQ Insulin reference range is ≤18.4 uIU/mL. Those are reference intervals. In a clamp study of normoglycemic adults, fasting insulin above 12.2 mU/L was specific for insulin resistance (specificity 0.82) and only moderately sensitive (sensitivity 0.57), so a lower result does not rule resistance out. A large Brazilian lab database proposed a 95% interval of about 2.5–13.1 µU/mL. Use one lab's assay when you compare results over time.
How do you calculate HOMA-IR?
HOMA-IR = fasting insulin (µIU/mL) × fasting glucose (mg/dL) / 405, using both values from the same fasting draw. If glucose is reported in mmol/L, divide by 22.5 instead. The formula comes from Matthews and colleagues, 1985. Example: 8 µIU/mL and 90 mg/dL gives 1.78. Example: 18 µIU/mL and 95 mg/dL gives 4.22. The ADA does not use HOMA-IR to diagnose prediabetes or diabetes.
Can fasting insulin be high when HbA1c is normal?
Yes. Early insulin resistance is often compensated by higher insulin secretion, so glucose and HbA1c can stay in the nondiabetic range. In the Whitehall II cohort, HOMA insulin sensitivity was already lower many years before a diabetes diagnosis, while the steep rise in glucose came later. HbA1c measures average glucose, not insulin. A normal HbA1c does not certify that fasting insulin is low.
How should you prepare for a fasting insulin test?
Plan on 8–12 hours without calories. Water is allowed. Schedule a morning draw so the clock time matches your last test. Quest lists its Cardio IQ Insulin as a fasting specimen. Skip a hard workout that morning, because a single exercise bout changes insulin sensitivity for hours. Repeat tests at the same laboratory. Insulin assays are not standardized across platforms.
Does a fasting insulin test diagnose prediabetes?
No. The American Diabetes Association defines prediabetes with HbA1c of 5.7–6.4%, fasting plasma glucose of 100–125 mg/dL, or a 2-hour oral glucose tolerance test of 140–199 mg/dL. Insulin is not part of that definition. A fasting insulin result is context for insulin resistance. Diagnosis belongs to the glucose criteria and to the clinician who ordered the panel.
Is fasting insulin one of Nuvo's biomarkers?
No. Fasting insulin is not one of Nuvo's 21 biomarkers. Nuvo's blood markers are HbA1c, fasting glucose, HDL, CRP, and creatinine. The app pairs those optional labs with HealthKit signals from an iPhone and Apple Watch, including resting heart rate, HRV, VO2 max, sleep, and steps, and it calculates a daily biological age score. On-device AI, no account, App Store privacy label Data Not Collected. It does not replace a fasting insulin lab.
Sources
- MedlinePlus. Insulin in blood. https://medlineplus.gov/lab-tests/insulin-in-blood/
- NIDDK. Insulin Resistance & Prediabetes. https://www.niddk.nih.gov/health-information/diabetes/overview/what-is-diabetes/prediabetes-insulin-resistance
- American Diabetes Association Professional Practice Committee. Diagnosis and classification of diabetes. Standards of Care in Diabetes—2025. Diabetes Care. https://doi.org/10.2337/dc25-s002
- Quest Diagnostics. Cardio IQ Insulin, test 91731. Reference range ≤18.4 uIU/mL, fasting specimen required. Quest test directory
- Labcorp. Insulin, test 004333. Reference interval 2.6–24.9 µIU/mL. https://www.labcorp.com/tests/004333/insulin
- Matthews DR, Hosker JP, Rudenski AS, Naylor BA, Treacher DF, Turner RC. Homeostasis model assessment: insulin resistance and β-cell function from fasting plasma glucose and insulin concentrations in man. Diabetologia. 1985;28(7):412-419. PMID 3899825
- McAuley KA, Williams SM, Mann JI, et al. Diagnosing insulin resistance in the general population. Diabetes Care. 2001;24(3):460-464. PMID 11289468
- Tabák AG, Jokela M, Akbaraly TN, Brunner EJ, Kivimäki M, Witte DR. Trajectories of glycaemia, insulin sensitivity, and insulin secretion before diagnosis of type 2 diabetes: an analysis from the Whitehall II study. Lancet. 2009;373(9682):2215-2221. PMID 19515410
- Manley SE, Stratton IM, Clark PM, Luzio SD. Comparison of 11 human insulin assays: implications for clinical investigation and research. Clin Chem. 2007;53(5):922-932. PMID 17363420
- Proposal for fasting insulin and HOMA-IR reference intervals based on an extensive Brazilian laboratory database. Arch Endocrinol Metab. PMC11554367
- Colberg SR, Sigal RJ, Yardley JE, et al. Physical Activity/Exercise and Diabetes: A Position Statement of the American Diabetes Association. Diabetes Care. 2016;39(11):2065-2079. PMID 27926890
- Bird SR, Hawley JA. Update on the effects of physical activity on insulin sensitivity in humans. BMJ Open Sport Exerc Med. 2016;2:e000143. PMID 28879026
- Spiegel K, Leproult R, Van Cauter E. Impact of sleep debt on metabolic and endocrine function. Lancet. 1999;354(9188):1435-1439. PMID 10543671
- Breneman CB, Tucker L. Dietary fibre consumption and insulin resistance — the role of body fat and physical activity. Br J Nutr. 2013;110(2):375-383. PMID 23218116
- Reynolds A, Mann J, Cummings J, Winter N, Mete E, Te Morenga L. Carbohydrate quality and human health: a series of systematic reviews and meta-analyses. Lancet. 2019;393(10170):434-445. PMID 30638909
- Magkos F, Fraterrigo G, Yoshino J, et al. Effects of Moderate and Subsequent Progressive Weight Loss on Metabolic Function and Adipose Tissue Biology in Humans with Obesity. Cell Metab. 2016;23(4):591-601. PMID 26916363
- Facchini FS, Hua N, Abbasi F, Reaven GM. Insulin resistance as a predictor of age-related diseases. J Clin Endocrinol Metab. 2001;86(8):3574-3578. PMID 11502781
- Levine ME, Lu AT, Quach A, et al. An epigenetic biomarker of aging for lifespan and healthspan. Aging (Albany NY). 2018;10(4):573-591. PMID 29676998